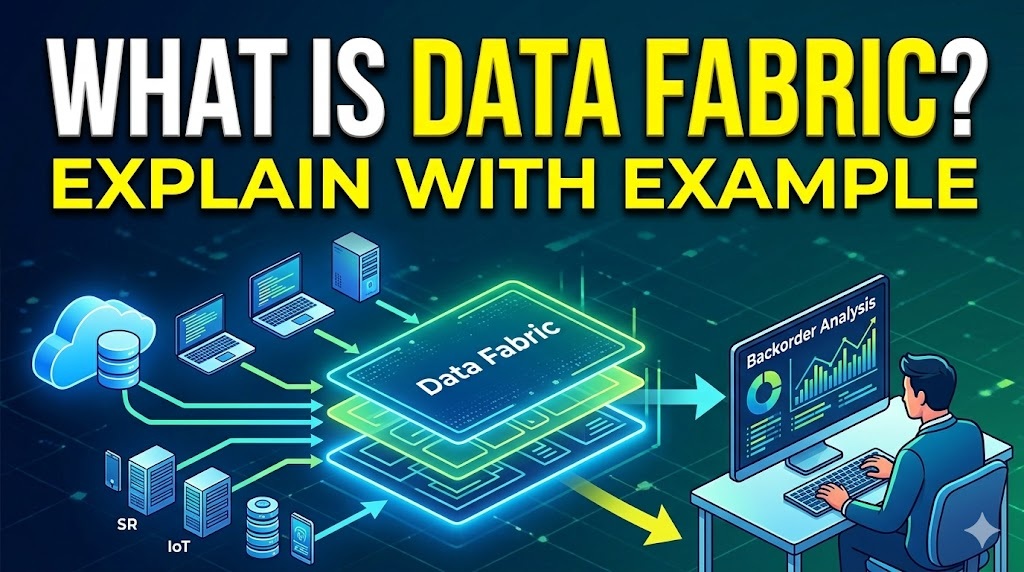
🌐 At its core, a Data Fabric is an advanced data architecture and set of services that act like a flexible, connective tissue over an organization’s entire data landscape.
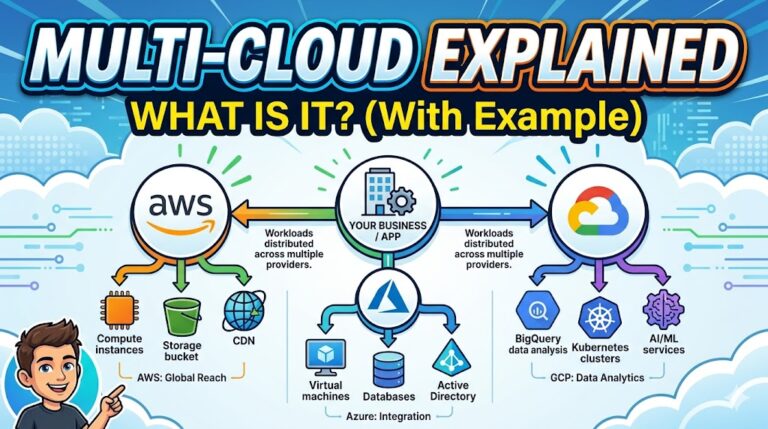
☁️ Instead of forcing you to copy and move all your data into one massive, central repository (like a Data Warehouse or Data Lake), a data fabric leaves the data where it is—whether it’s on-premises, in multiple clouds, or on edge devices. It creates an intelligent, unified layer on top of these disparate systems, making the data easily accessible and manageable for whoever needs it.
💡 To understand why this is valuable, it helps to look at the problem it solves and how it works in the real world.
🍝 The Problem: Data Silos and “Spaghetti” Code
🚧 Historically, if a business wanted to combine data from System A and System B, engineers had to build a custom pipeline to extract, transform, and load (ETL) that data into System C. As companies grew and adopted hundreds of software applications across different clouds, this created an unmanageable web of custom integrations—often referred to as “spaghetti architecture.”
🛑 Data became trapped in isolated silos.
✨ How Data Fabric Fixes It (An Example)
🏢 Imagine a large, multinational retail company. Their data is scattered everywhere:
- 📦 Inventory Data: Sitting in an older, on-premises SQL database.
- 👤 Customer Profiles: Hosted in a cloud-based CRM like Salesforce.
- 📈 Website Analytics: Stored in a cloud Data Lake (like AWS S3).
🎯 The Scenario: A business analyst wants to know: “Which specific website features lead to the most high-value customers buying out-of-stock items on backorder?”
- ⏳ Without a Data Fabric: The analyst submits an IT ticket. Data engineers spend weeks building new data pipelines to extract the inventory, CRM, and web analytics data, clean it, map it together, and load it into a new database just so the analyst can run their report.
- ⚡ With a Data Fabric: The fabric sits above all three systems. It automatically scans them and uses AI and metadata (data about the data) to understand the relationships. It knows that “Item_ID” in the inventory database matches “Product_Code” in the web analytics, and that “User_Email” connects to the CRM. The analyst can simply query the Data Fabric directly to get their answer immediately. The fabric automatically fetches and joins the relevant data from the underlying systems on the fly.
⚙️ The Core Capabilities of a Data Fabric
🏗️ For a system to truly be considered a data fabric, it usually relies on a few key pillars:
- 🔍 Active Metadata Management: It constantly reads and analyzes the metadata of your systems to understand what data exists and how it changes over time.
- 🔗 Knowledge Graphs: It maps out the relationships between different data points visually and logically, linking related concepts across different databases.
- 🤖 Automated Integration: It uses AI to suggest or automatically build connections between data sources, reducing the need for manual coding.
- 🛡️ Unified Governance: It allows administrators to set security and privacy rules in one place (e.g., “Mask all credit card numbers”), and those rules are enforced universally, regardless of where the data actually lives.
🎥 Video Transcript: డేటా ఫ్యాబ్రిక్ (Data Fabric) అవగాహన
🌐 Scene 1: The Concept
- 👁️ [Visual: Avatar stands in the center. A subtle, glowing network graphic appears in the background.]
- 🗣️ Avatar (Spoken): ప్రధానంగా, డేటా ఫ్యాబ్రిక్ (Data Fabric) అనేది ఒక అధునాతన డేటా ఆర్కిటెక్చర్ మరియు సేవల సముదాయం. ఇది ఒక సంస్థ యొక్క మొత్తం డేటా ల్యాండ్స్కేప్పై అనువైన, బంధన కణజాలం వలె పనిచేస్తుంది.
- 👁️ [Visual: Icons appear on screen showing a server (On-Prem), a cloud, and a mobile phone (Edge Device). A glowing umbrella layer appears over all three.]
- 🗣️ Avatar (Spoken): మీ డేటా మొత్తాన్ని కాపీ చేసి ఒకే భారీ, కేంద్రీకృత రిపోజిటరీలోకి తరలించమని మిమ్మల్ని బలవంతం చేయడానికి బదులుగా, డేటా ఫ్యాబ్రిక్ ఆ డేటాను ఉన్నచోటే ఉంచుతుంది—అది ఆన్-ప్రిమిసెస్ (స్థానికంగా) అయినా, బహుళ క్లౌడ్లలో అయినా లేదా ఎడ్జ్ పరికరాల్లో అయినా సరే. ఇది ఈ వేర్వేరు సిస్టమ్లపై ఒక తెలివైన, ఏకీకృత పొరను సృష్టిస్తుంది, దీని వలన డేటా అవసరమైన వారికి సులభంగా అందుబాటులో ఉంటుంది మరియు నిర్వహించడానికి వీలుగా ఉంటుంది.
🍝 Scene 2: The Problem
- 👁️ [Visual: Avatar shifts slightly to the left. A tangled, messy web of lines connecting different system blocks appears on the right (“Spaghetti Architecture”).]
- 🗣️ Avatar (Spoken): ఇది ఎందుకు విలువైనదో అర్థం చేసుకోవడానికి, ఇది పరిష్కరించే సమస్యను చూద్దాం. చారిత్రాత్మకంగా, ఒక వ్యాపార సంస్థ సిస్టమ్ A మరియు సిస్టమ్ B నుండి డేటాను కలపాలనుకుంటే, ఇంజనీర్లు ఆ డేటాను సిస్టమ్ C లోకి తీసుకురావడానికి, మార్చడానికి, మరియు లోడ్ చేయడానికి ఒక కస్టమ్ పైప్లైన్ను నిర్మించాల్సి వచ్చేది.
- 👁️ [Visual: A red “X” appears over the tangled web, and the words “Data Silos” pop up.]
- 🗣️ Avatar (Spoken): కంపెనీలు పెరిగేకొద్దీ మరియు విభిన్న క్లౌడ్లలో వందలాది సాఫ్ట్వేర్ అప్లికేషన్లను స్వీకరించడం వలన, ఇది నిర్వహించలేని కస్టమ్ ఇంటిగ్రేషన్ల వెబ్ను సృష్టించింది—దీనిని తరచుగా “స్పాగెట్టీ ఆర్కిటెక్చర్” అని పిలుస్తారు. డేటా వేరుచేయబడిన సైలోలలో (silos) చిక్కుకుపోయింది.
✨ Scene 3: The Solution in Action
- 👁️ [Visual: Cut to three distinct icons: A database (Inventory), a CRM logo (Salesforce), and a cloud bucket (AWS S3).]
- 🗣️ Avatar (Spoken): డేటా ఫ్యాబ్రిక్ దీనిని ఎలా పరిష్కరిస్తుందో ఒక ఉదాహరణతో చూద్దాం. ఒక పెద్ద, బహుళజాతి రిటైల్ కంపెనీని ఊహించుకోండి. వారి డేటా అంతటా చెల్లాచెదురుగా ఉంది: ఇన్వెంటరీ డేటా పాత ఆన్-ప్రిమిసెస్ SQL డేటాబేస్లో ఉంది, కస్టమర్ ప్రొఫైల్స్ సేల్స్ఫోర్స్ లాంటి క్లౌడ్-ఆధారిత CRMలో ఉన్నాయి, మరియు వెబ్సైట్ అనలిటిక్స్ క్లౌడ్ డేటా లేక్లో నిల్వ చేయబడ్డాయి.
- 👁️ [Visual: Text overlay appears with the scenario question in Telugu or English.]
- 🗣️ Avatar (Spoken): ఒక బిజినెస్ అనలిస్ట్ ఈ విషయం తెలుసుకోవాలనుకుంటున్నాడు: “స్టాక్ లేని వస్తువులను బ్యాక్ఆర్డర్లో కొనుగోలు చేయడానికి ఏ నిర్దిష్ట వెబ్సైట్ ఫీచర్లు అధిక-విలువైన కస్టమర్లను ప్రేరేపిస్తున్నాయి?”
- 👁️ [Visual: An animation shows an hourglass or calendar, representing wasted time.]
- ⏳ Avatar (Spoken): డేటా ఫ్యాబ్రిక్ లేకుండా, అనలిస్ట్ ఒక ఐటీ (IT) టిక్కెట్ను సమర్పిస్తాడు. డేటా ఇంజనీర్లు ఇన్వెంటరీ, CRM మరియు వెబ్ అనలిటిక్స్ డేటాను సేకరించి, క్లీన్ చేసి కొత్త డేటాబేస్లోకి లోడ్ చేయడానికి కొత్త డేటా పైప్లైన్లను నిర్మిస్తూ వారాల తరబడి సమయం వెచ్చిస్తారు.
- 👁️ [Visual: A smooth, connected grid (Data Fabric) drops over the three icons, instantly linking them with glowing lines.]
- ⚡ Avatar (Spoken): డేటా ఫ్యాబ్రిక్తో, ఫ్యాబ్రిక్ ఈ మూడు సిస్టమ్ల పైన అమరి ఉంటుంది. ఇది స్వయంచాలకంగా వాటిని స్కాన్ చేస్తుంది మరియు సంబంధాలను అర్థం చేసుకోవడానికి AI మరియు మెటాడేటాను ఉపయోగిస్తుంది. ఇన్వెంటరీ డేటాబేస్లోని “Item_ID”, వెబ్ అనలిటిక్స్లోని “Product_Code”కి సరిపోలుతుందని మరియు “User_Email” CRMకి కనెక్ట్ అవుతుందని దానికి తెలుసు. అనలిస్ట్ నేరుగా డేటా ఫ్యాబ్రిక్ను ప్రశ్నించడం ద్వారా తమ సమాధానాన్ని వెంటనే పొందవచ్చు. ఫ్యాబ్రిక్ అంతర్లీన సిస్టమ్ల నుండి సంబంధిత డేటాను స్వయంచాలకంగా మరియు అప్పటికప్పుడే గ్రహించి జతచేస్తుంది.
⚙️ Scene 4: Core Capabilities
- 👁️ [Visual: Avatar returns to the center. Four bullet points animate onto the screen one by one as they are mentioned.]
- 🗣️ Avatar (Spoken): ఒక సిస్టమ్ నిజంగా డేటా ఫ్యాబ్రిక్గా పరిగణించబడాలంటే, అది సాధారణంగా కొన్ని కీలక స్తంభాలపై ఆధారపడి ఉంటుంది:
- 👁️ [Visual: Highlight Bullet 1]
- 🔍 Avatar (Spoken): మొదటిది, యాక్టివ్ మెటాడేటా మేనేజ్మెంట్: ఏ డేటా ఉందో మరియు కాలక్రమేణా అది ఎలా మారుతుందో అర్థం చేసుకోవడానికి ఇది మీ సిస్టమ్ల మెటాడేటాను నిరంతరం చదువుతుంది మరియు విశ్లేషిస్తుంది.
- 👁️ [Visual: Highlight Bullet 2]
- 🔗 Avatar (Spoken): రెండవది, నాలెడ్జ్ గ్రాఫ్లు: ఇది వివిధ డేటాబేస్ల ద్వారా సంబంధిత భావనలను అనుసంధానిస్తూ, వివిధ డేటా పాయింట్ల మధ్య సంబంధాలను దృశ్యపరంగా మరియు తార్కికంగా మ్యాప్ చేస్తుంది.
- 👁️ [Visual: Highlight Bullet 3]
- 🤖 Avatar (Spoken): మూడవది, ఆటోమేటెడ్ ఇంటిగ్రేషన్: మాన్యువల్ కోడింగ్ అవసరాన్ని తగ్గిస్తూ, డేటా వనరుల మధ్య కనెక్షన్లను సూచించడానికి లేదా స్వయంచాలకంగా నిర్మించడానికి ఇది AI ని ఉపయోగిస్తుంది.
- 👁️ [Visual: Highlight Bullet 4]
- 🛡️ Avatar (Spoken): నాల్గవది, యూనిఫైడ్ గవర్నెన్స్: ఇది ఒకే చోట భద్రత మరియు గోప్యతా నియమాలను సెట్ చేయడానికి నిర్వాహకులను అనుమతిస్తుంది, మరియు ఆ నియమాలు డేటా వాస్తవంగా ఎక్కడ ఉన్నా సరే, విశ్వవ్యాప్తంగా అమలు చేయబడతాయి.